The Coming Credit Event - Charts Before the Storm
There’s no way the biggest and longest credit expansion in the history of the world ends in a credit whimper.

As I have written about here, the corporate bond market has become toxic due to increased leverage levels, the record issuance of low-quality bonds, and leveraged loans (this cycle’s poster boy for excess). All of this has been made possible by the synchronized global central bank policy of lowering interest rates to zero (or below zero) after the Global Financial Crisis.
Chart 1: Ratio of U.S. Corporate Debt to GDP[1]

Chart 2: BBB Share of Corporate Debt Outstanding[2]

The Coming Credit Event
It seems highly likely that such excess will culminate in a credit event that will mark the end of the current expansion and set the stage for the next bull market. Unlike the last cycle, this credit event is unlikely to involve the banks (at least in the U.S.) since they are much better capitalized compared to where they were in 2007-8. However, there will likely be significant bank stress in Europe with German, Italian, and Spanish banks already showing signs of extreme distress. For instance, Deutsche Bank is most likely technically insolvent already, but will almost certainly be merged with Commerzbank. As the old saying goes, two wrongs don’t make a right, and the merger will not solve the German banking problem. The combined entity will likely by nationalized to some extent as German government investment is required to restore the balance sheet.
Chart 3: European Banks – 20-Year Charts[3]


So where will the credit event be located? Most likely in the countries and non-financial sectors that have become the most leveraged. Healthcare, Consumer Discretionary, Consumer Staples, Energy, and Utilities all stand out as over leveraged U.S. sectors ripe for a credit event.
Chart 4: U.S. Net Debt to EBITDA by Sector[4]
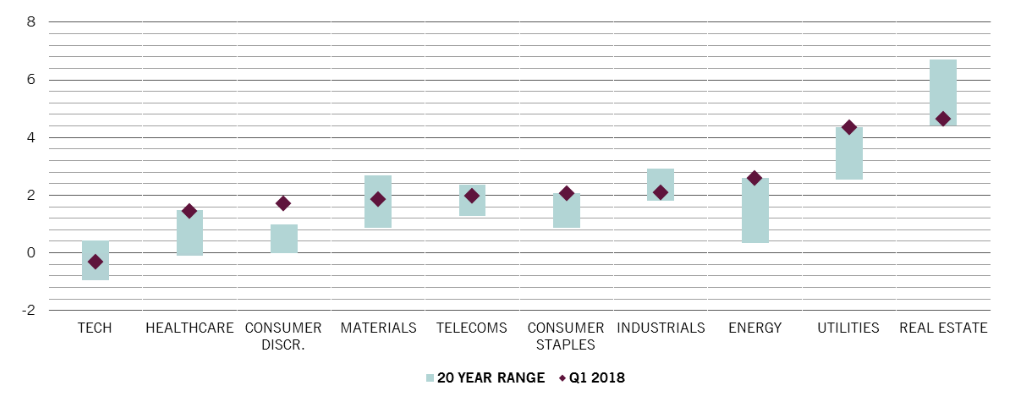
Chart 5: Global Corporate Debt, Ex-Financials by Region[5]

Of course, governments have led the way in the debt explosion with only Germany eliminating the debt it created after the Global Financial Crisis.
Chart 6: Central Government Debt[6]

In aggregate, the world has gone from $100 trillion in total debt in 2003 to $247 trillion in total debt in 2018. Over that time household and financial firm debt has roughly doubled while non-financial firm and government debt has roughly tripled. None of that is sustainable. As many have observed, it takes more and more debt to produce a dollar of growth.
Chart 7: Change in Global Debt[7]

Bond Market Volatility
While many market observers follow the VIX volatility index, which measures the volatility of S&P 500 Index futures, fewer are familiar with the MOVE index, which measures the volatility of the U.S. Treasury yield curve. While the MOVE index does not have as big of percentage changes as the VIX, almost every market selloff ends with the MOVE index ramping to equal the percentage VIX move. As can be seen the chart below, the MOVE index is only 50 percent of the VIX, near all-time lows (bottom pane).
Chart 8: MOVE v. VIX Volatility[8]

There’s no way the biggest and longest credit expansion in the history of the world ends in a credit whimper. Stick around for the bang, it should be something.
[1] Sam Goldfarb and Rachel Louis Ensign; Corporate Debt is Reaching Record Levels; The Wall Street Journal; December 29, 2018; Available at: https://www.wsj.com/articles/corporate-debt-is-reaching-record-levels-11546099201?emailToken=e7179daa588e424af140ac57665b311cTEf3KFuTyhJpQHMawh756brCS/rvE3Qjyc/KaN2KuqVTMYWU/VDRaK8BQChXNNBQ/CmC0r0kXTQNDV6oomWgDWcHxjS3dHxVa6MLoVUrarQ%3D&reflink=article_gmail_share; Accessed January 7, 2019.
[2] Id.
[3] Bloomberg. January 4, 2017. Deutsche Bank; Commerzbank; Unicredit; and Banca Monte Dei Paschi Siena.
[4] Supriya Menon, Pictet Asset Management; “Corporate borrowing: cause for caution?”; June 2018; Available at: https://www.am.pictet/en/us/global-articles/2018/market-views/in-brief/corporate-debt-problem; Accessed January 4, 2019.
[5] Id.
[6] Aaron Kuriloff; Taking Stock of the World’s Debt; January 2, 2019; the Wall Street Journal; Available at: https://www.wsj.com/articles/taking-stock-of-the-worlds-debt-11545906600?emailToken=7e3c4438ace6f1ac9abd08284574b167iK2vdzjBhv4mk9g7zS5U+PeTFTiIk2YyabLR2pxTDdot+xGxJB2xWwKIDTeBvlpjB+0cN+dXk+hfAflcblfY6w%3D%3D&reflink=article_gmail_share; Accessed January 7, 2019.
[7] Bloomberg; The Year in Money (2018); Available at: https://www.bloomberg.com/graphics/2018-year-in-money/?utm_campaign=socialflow-organic&utm_source=twitter&utm_content=business&utm_medium=social&cmpid=socialflow-twitter-business; Accessed January 7, 2019.
[8] Bloomberg. January 7, 2019.